Jillian Holbrook
Samantha Himegarner
Jillian Holbrook
Samantha Himegarner
Skills you’ll gain in this topic:
- Explain how phylogenetic trees represent evolutionary relationships among species.
- Describe the use of morphological and molecular data to construct phylogenies.
- Interpret phylogenetic trees and cladograms to understand evolutionary pathways.
- Compare different species' evolutionary relationships using phylogenetic diagrams.
- Relate phylogenetic trees to the concept of speciation and descent with modification.
Phylogenetic Trees
Phylogenetic trees offer a visual representation of evolutionary relationships, and can even offer a timeline of evolution by showing the amount of change in organisms over time. This type of diagram shows evolutionary relationships through distance, as organisms more closely related are located near each other and less closely related organisms are further apart.
More than that, phylogenetic trees show the traits gained or lost by species over time. By doing this, phylogenetic trees are a fundamental tool in evolutionary biology to understand the relationships between different species, examine linked lineages, and study the evolution of different characteristics and traits. 🧬🌳
Cladograms
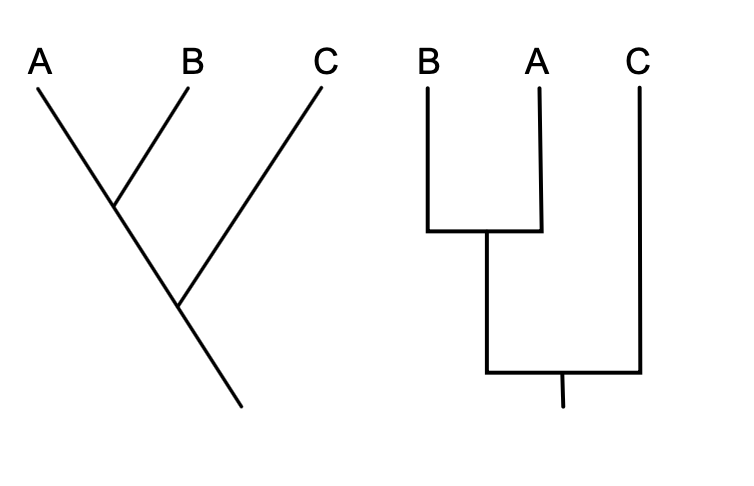
Phylogenetic trees and cladograms both show relationships between lineages, but phylogenetic trees show the amount of change over time, which is calibrated by fossils or a molecular clock. Shared characteristics are present in more than one lineage. Derived traits are inherited from common ancestors. Comparing these characteristics of species informs the construction of evolutionary diagrams.
Cladograms typically focus on morphological (visible trait) similarities between species, such as beak type, meaning cladograms can be hypothesized with reasonable differences. However, molecular data, like DNA and/or protein sequence similarities, in phylogenetic trees often provide more accurate and reliable evidence than morphological traits. 🦜

A cladogram is shown to the left, and a phylogenetic tree is pictured to the right. Image courtesy of WikiMedia Commons.
Speciation
Still, cladograms and phylogenetic trees both still illustrate common ancestry and speciation.
Speciation is the process by which new species are formed. It occurs when a group of organisms becomes isolated from the rest of their population and evolves into a separate species over time through a variety of mechanisms, including geographical isolation, reproductive isolation, or ecological isolation.
Nodes, or the points in which two species diverge/speciate, help point out the most recent common ancestor of different species, which perhaps shows a trait that was shared, gained, or lost. The “out-group” represents the lineage or species that is the least closely related to the rest of the organisms shown. 🐆
It is important to remember that phylogenetic trees and cladograms represent hypotheses, which means that they are constantly being revised based on new scientific evidence. This tool enables us to make predictions, but they do not perfectly model all evolutionary relationships.
Check out the AP Bio Unit 7 Replays or watch the 2021 Unit 7 Cram
<< Hide Menu
Jillian Holbrook
Samantha Himegarner
Jillian Holbrook
Samantha Himegarner
Skills you’ll gain in this topic:
- Explain how phylogenetic trees represent evolutionary relationships among species.
- Describe the use of morphological and molecular data to construct phylogenies.
- Interpret phylogenetic trees and cladograms to understand evolutionary pathways.
- Compare different species' evolutionary relationships using phylogenetic diagrams.
- Relate phylogenetic trees to the concept of speciation and descent with modification.
Phylogenetic Trees
Phylogenetic trees offer a visual representation of evolutionary relationships, and can even offer a timeline of evolution by showing the amount of change in organisms over time. This type of diagram shows evolutionary relationships through distance, as organisms more closely related are located near each other and less closely related organisms are further apart.
More than that, phylogenetic trees show the traits gained or lost by species over time. By doing this, phylogenetic trees are a fundamental tool in evolutionary biology to understand the relationships between different species, examine linked lineages, and study the evolution of different characteristics and traits. 🧬🌳
Cladograms
Phylogenetic trees and cladograms both show relationships between lineages, but phylogenetic trees show the amount of change over time, which is calibrated by fossils or a molecular clock. Shared characteristics are present in more than one lineage. Derived traits are inherited from common ancestors. Comparing these characteristics of species informs the construction of evolutionary diagrams.
Cladograms typically focus on morphological (visible trait) similarities between species, such as beak type, meaning cladograms can be hypothesized with reasonable differences. However, molecular data, like DNA and/or protein sequence similarities, in phylogenetic trees often provide more accurate and reliable evidence than morphological traits. 🦜

A cladogram is shown to the left, and a phylogenetic tree is pictured to the right. Image courtesy of WikiMedia Commons.
Speciation
Still, cladograms and phylogenetic trees both still illustrate common ancestry and speciation.
Speciation is the process by which new species are formed. It occurs when a group of organisms becomes isolated from the rest of their population and evolves into a separate species over time through a variety of mechanisms, including geographical isolation, reproductive isolation, or ecological isolation.
Nodes, or the points in which two species diverge/speciate, help point out the most recent common ancestor of different species, which perhaps shows a trait that was shared, gained, or lost. The “out-group” represents the lineage or species that is the least closely related to the rest of the organisms shown. 🐆
It is important to remember that phylogenetic trees and cladograms represent hypotheses, which means that they are constantly being revised based on new scientific evidence. This tool enables us to make predictions, but they do not perfectly model all evolutionary relationships.
Check out the AP Bio Unit 7 Replays or watch the 2021 Unit 7 Cram

© 2024 Fiveable Inc. All rights reserved.