2.7 Market Disequilibrium and Changes in Equilibrium
6 min read•june 18, 2024
Jeanne Stansak
Jeanne Stansak
Equilibrium and Disequilibrium
In section 2.6, we discussed what happens when we bring together consumers and producers in a market. We determined that a market will settle where the quantity demanded equals the quantity supplied, so there is a perfect allocation of resources to satisfy consumer demands. We called the state the market equilibrium price and quantity for a market and visualized it as the point at which the demand curve intersects the supply curve.
However, what happens when the market isn't producing at equilibrium? What happens if the price is too high or too low, or the quantity produced is too little or too much (We'll see how each of these questions actually correspond to eachother!). A state at which the quantity demanded doesn't equal the quantity supplied is called market disequilibrium, and is usually caused by a price above or below the equilibrium price, causing a discrepancy between Qd and Qs. This guide will dive into what market disequilibrium is, how it impacts a market, along with different types of changes in equilibrium when curves shift.
Shortages and Surpluses
As we discussed, market disequilibrium is a state at which quantity demanded does not equal quantity supplied. This can happen in two ways. First, quantity demanded may be greater than quantity supplied. This is called a shortage. In this state, too many people want the good compared to how many firms are willing to sell it. Conversely, quantity supplied may be greater than quantity demanded. This is called a surplus. In this state, too many firms are willing to sell the good, but not many consumers are willing and/or able to purchase it.
Visualizing Shortages and Surpluses
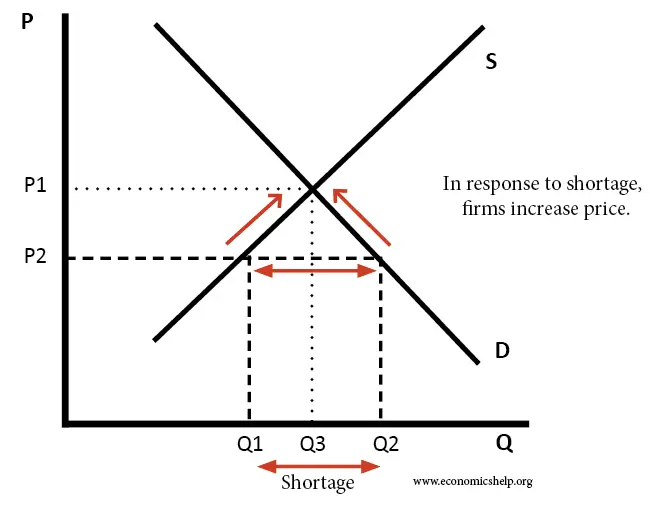
We can visualize shortages and surpluses by manipulating the price in a market to be above or below equilibrium. When the price of a good is too low, fewer suppliers will be willing to sell the good because of the law of supply. Conversely, when price falls, more consumers will be willing and able to purchase the good. This leads to a shortage and is visualized in the graph below. Q2 and P2 are the equilibrium price and quantity in this market, but at P1, Q3 is demanded but only Q1 is supplied, meaning we have a shortage of Q3 - Q1.

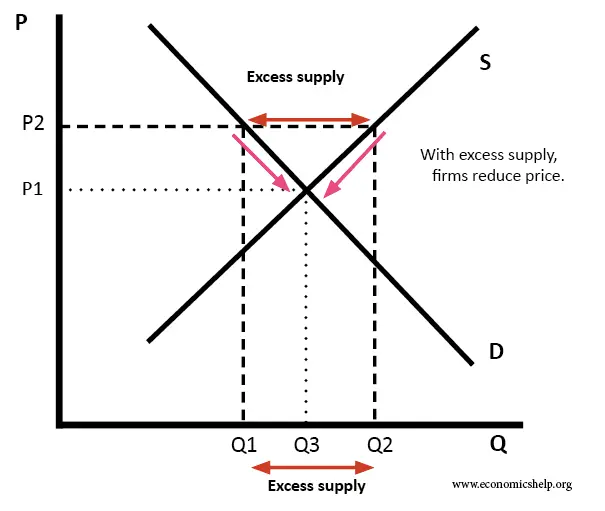
We can use the same model to visualize a surplus. When the price of a good is too high, the opposite occurs. More sellers are willing to sell for a high price, but fewer consumers are willing and/or able to actually buy the good.

Adjustment in the Long Run
Economists argue that in the long run, markets will trend towards equilibrium. This means that when in a state of surplus or shortage, the price will naturally move back to equilibrium, since in either state someone is dissatisfied. In a surplus, consumers who otherwise would be willing and able to buy the good are not able to because of the high price. In a shortage, firms are unable to satisfy all consumers because the price is too low. In either state, total, or economic surplus is not maximized.
Thus, in a surplus, the price will decrease, and in a shortage, the price will increase. This makes somewhat logical sense. When consumers are clammoring to get a good, they will eventually be willing to pay higher prices, and when there is a surplus of a good, the price will naturally drop because the good feels less valuable.
Consumer Surplus, Producer Surplus, and Deadweight Loss
We can also look at what happens to consumer and producer surplus when the market is not at equilibrium. As a reminder, consumer surplus is the difference between what a consumer is willing to pay and actually pays, and producer surplus is the difference between what a producer is willing to pay and actually pays. When the market is at equilibrium, total surplus is maximized.
When we are not at equilibrium, at least one group will lose surplus. In the case of a shortage, the producers always lose surplus, since a firm who would be willing to pay equilibrium price may not be able to because of an artificially low price. The lost surplus is known as deadweight loss and is visualized in the graph below:
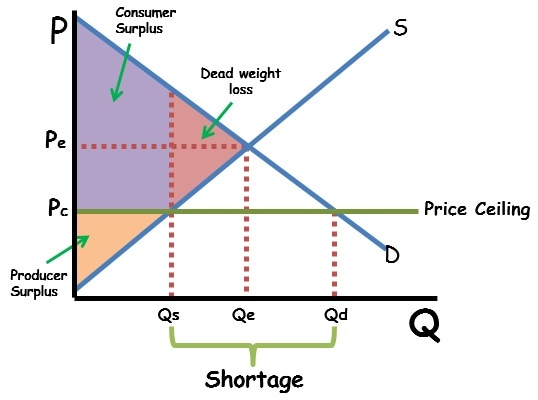
In this graph, the orange triangle is producer surplus. Note that all suppliers between Qs and Qe aren't able to participate in the market. Consumer surplus is also impacted, since although everyone to Qd is willing and able to purchase a good, only Qs is supplied, so consumer surplus is cut off. This leaves a triangle of deadweight loss between Qs and Qe.
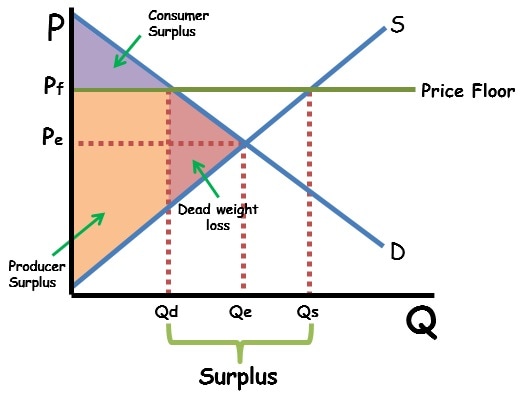
This can also be seen with a surplus with similar logic being applied:
Changes in Market Equilibrium
Market equilibrium can also change when curve shift. In previous sections, we described how different determinants of supply and demand can shift the entire curve when they change. When curves shift, they change the point at which Qs and Qd are equal, meaning our equilibrium price and quantity change as well.
It's important to note that the following explanations (or anything in this unit, for that matter) should not be memorized. Instead, understand the model and understand how to draw it changing. My motto for AP Econ is "When in doubt, graph it out!"
When demand shifts, price and quantity will change in the same direction. With a demand increase, equilibrium price and quantity both increase as well, and when demand decreases, equilibrium price and quantity decrease.
For example, suppose there is an increase in college enrollments, causing an increase in the demand (not quantity demanded) for textbooks. The following graph shows how the equilibrium price and quantity increase when the curve shifts:

When the demand curve shifts right, price moves from P1 to P2 and quantity moves from Q1 to Q1. Note that this does not create a shortage or surplus, since we have a whole new demand curve! Instead, we now produce Q2 textbooks at a price of P2.
Conversely, a negative shift in demand will lead to a decrease in the equilibrium price and quantity:

In this example, quantity falls from Q to Q1 and price falls from P to P1. Again, no shortage or surplus occurs, but rather the equilibrium has changed.
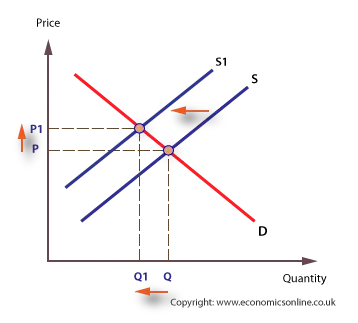
Similar events occur when supply shifts. When the supply curve shifts right or left, quantity and price move in opposite directions. For example, suppose the price of oil, a resource in making cars, increases. This will lead to a leftward shift in the supply curve, increasing price, but decreasing quantity:
A rightward shift in supply does the opposite, increasing quantity and decreasing price:

In any scenario where a curve shifts, the market does not gain deadweight loss. This is because the market is still producing where Qd = Qs, that point has just changed.
Double-Shift Problems
Sometimes, an event occurs called a double shift, in which both supply and demand shift. When this occurs, one of the new equilibrium points (either price or quantity) will be indeterminate. This is because we don't know how much each curve shifts (without more math that isnt necessary for AP Micro). When two shifts lead to clashing effects, we can't say for sure what happens.
For example, suppose in the market for textbooks college attendance rises, increasing demand, but the price of paper increases, decreasing supply.
When demand rises, price and quantity both rise
When supply decreases, price rises, but quantity decreases
Therefore, we know for sure that the price will increase, but we can't say for sure what happens to quantity. If the increase in quantity from the demand increase outweighed the supply decrease, then Q will increase and vise-versa, but we don't know. We would say that from this double shift, price increases, and quantity is indeterminate.
This can be visualized in graph 7 in the following graphs. Try to see how the other graphs lead to indeterminate outputs as well:

This chart also helps to understand double shifts. However, remember that none of this has to be memorized! If you can graph the model, you can usually logic out double shift problems.

<< Hide Menu
2.7 Market Disequilibrium and Changes in Equilibrium
6 min read•june 18, 2024
Jeanne Stansak
Jeanne Stansak
Equilibrium and Disequilibrium
In section 2.6, we discussed what happens when we bring together consumers and producers in a market. We determined that a market will settle where the quantity demanded equals the quantity supplied, so there is a perfect allocation of resources to satisfy consumer demands. We called the state the market equilibrium price and quantity for a market and visualized it as the point at which the demand curve intersects the supply curve.
However, what happens when the market isn't producing at equilibrium? What happens if the price is too high or too low, or the quantity produced is too little or too much (We'll see how each of these questions actually correspond to eachother!). A state at which the quantity demanded doesn't equal the quantity supplied is called market disequilibrium, and is usually caused by a price above or below the equilibrium price, causing a discrepancy between Qd and Qs. This guide will dive into what market disequilibrium is, how it impacts a market, along with different types of changes in equilibrium when curves shift.
Shortages and Surpluses
As we discussed, market disequilibrium is a state at which quantity demanded does not equal quantity supplied. This can happen in two ways. First, quantity demanded may be greater than quantity supplied. This is called a shortage. In this state, too many people want the good compared to how many firms are willing to sell it. Conversely, quantity supplied may be greater than quantity demanded. This is called a surplus. In this state, too many firms are willing to sell the good, but not many consumers are willing and/or able to purchase it.
Visualizing Shortages and Surpluses
We can visualize shortages and surpluses by manipulating the price in a market to be above or below equilibrium. When the price of a good is too low, fewer suppliers will be willing to sell the good because of the law of supply. Conversely, when price falls, more consumers will be willing and able to purchase the good. This leads to a shortage and is visualized in the graph below. Q2 and P2 are the equilibrium price and quantity in this market, but at P1, Q3 is demanded but only Q1 is supplied, meaning we have a shortage of Q3 - Q1.

We can use the same model to visualize a surplus. When the price of a good is too high, the opposite occurs. More sellers are willing to sell for a high price, but fewer consumers are willing and/or able to actually buy the good.

Adjustment in the Long Run
Economists argue that in the long run, markets will trend towards equilibrium. This means that when in a state of surplus or shortage, the price will naturally move back to equilibrium, since in either state someone is dissatisfied. In a surplus, consumers who otherwise would be willing and able to buy the good are not able to because of the high price. In a shortage, firms are unable to satisfy all consumers because the price is too low. In either state, total, or economic surplus is not maximized.
Thus, in a surplus, the price will decrease, and in a shortage, the price will increase. This makes somewhat logical sense. When consumers are clammoring to get a good, they will eventually be willing to pay higher prices, and when there is a surplus of a good, the price will naturally drop because the good feels less valuable.


Consumer Surplus, Producer Surplus, and Deadweight Loss
We can also look at what happens to consumer and producer surplus when the market is not at equilibrium. As a reminder, consumer surplus is the difference between what a consumer is willing to pay and actually pays, and producer surplus is the difference between what a producer is willing to pay and actually pays. When the market is at equilibrium, total surplus is maximized.
When we are not at equilibrium, at least one group will lose surplus. In the case of a shortage, the producers always lose surplus, since a firm who would be willing to pay equilibrium price may not be able to because of an artificially low price. The lost surplus is known as deadweight loss and is visualized in the graph below:

In this graph, the orange triangle is producer surplus. Note that all suppliers between Qs and Qe aren't able to participate in the market. Consumer surplus is also impacted, since although everyone to Qd is willing and able to purchase a good, only Qs is supplied, so consumer surplus is cut off. This leaves a triangle of deadweight loss between Qs and Qe.
This can also be seen with a surplus with similar logic being applied:

Changes in Market Equilibrium
Market equilibrium can also change when curve shift. In previous sections, we described how different determinants of supply and demand can shift the entire curve when they change. When curves shift, they change the point at which Qs and Qd are equal, meaning our equilibrium price and quantity change as well.
It's important to note that the following explanations (or anything in this unit, for that matter) should not be memorized. Instead, understand the model and understand how to draw it changing. My motto for AP Econ is "When in doubt, graph it out!"
When demand shifts, price and quantity will change in the same direction. With a demand increase, equilibrium price and quantity both increase as well, and when demand decreases, equilibrium price and quantity decrease.
For example, suppose there is an increase in college enrollments, causing an increase in the demand (not quantity demanded) for textbooks. The following graph shows how the equilibrium price and quantity increase when the curve shifts:

When the demand curve shifts right, price moves from P1 to P2 and quantity moves from Q1 to Q1. Note that this does not create a shortage or surplus, since we have a whole new demand curve! Instead, we now produce Q2 textbooks at a price of P2.
Conversely, a negative shift in demand will lead to a decrease in the equilibrium price and quantity:

In this example, quantity falls from Q to Q1 and price falls from P to P1. Again, no shortage or surplus occurs, but rather the equilibrium has changed.
Similar events occur when supply shifts. When the supply curve shifts right or left, quantity and price move in opposite directions. For example, suppose the price of oil, a resource in making cars, increases. This will lead to a leftward shift in the supply curve, increasing price, but decreasing quantity:

A rightward shift in supply does the opposite, increasing quantity and decreasing price:

In any scenario where a curve shifts, the market does not gain deadweight loss. This is because the market is still producing where Qd = Qs, that point has just changed.
Double-Shift Problems
Sometimes, an event occurs called a double shift, in which both supply and demand shift. When this occurs, one of the new equilibrium points (either price or quantity) will be indeterminate. This is because we don't know how much each curve shifts (without more math that isnt necessary for AP Micro). When two shifts lead to clashing effects, we can't say for sure what happens.
For example, suppose in the market for textbooks college attendance rises, increasing demand, but the price of paper increases, decreasing supply.
When demand rises, price and quantity both rise
When supply decreases, price rises, but quantity decreases
Therefore, we know for sure that the price will increase, but we can't say for sure what happens to quantity. If the increase in quantity from the demand increase outweighed the supply decrease, then Q will increase and vise-versa, but we don't know. We would say that from this double shift, price increases, and quantity is indeterminate.
This can be visualized in graph 7 in the following graphs. Try to see how the other graphs lead to indeterminate outputs as well:

This chart also helps to understand double shifts. However, remember that none of this has to be memorized! If you can graph the model, you can usually logic out double shift problems.


© 2024 Fiveable Inc. All rights reserved.