dylan_black_2025
dylan_black_2025
Unit 2 Overview: Supply and Demand
Unit 2 of AP Micro is the first micro specific unit in this class! Unlike unit 1, which is almost entirely the same between AP Macro and AP Micro, unit 2 will dive deep into some directly microeconomic topics. In particular, we'll be uncovering the most fundamental model in microeconomics: supply and demand. We'll begin by developing what the model looks like and actually means, and then look into some more detailed topics regarding how the model changes under certain conditions.
To begin, we have to understand what we mean by a market. In microeconomics, a market is a social structure that brings together consumers, or demanders, and producers, or suppliers. These two groups either purchase goods or sell goods, meaning they are mutually dependent on each other. For a consumer to consume, there must be a producer to produce, and vice-versa.
We'll then move into how consumers and producers act by constructing the demand curve for consumers and the supply curve for producers. These curves model how consumers and producers react to changes in price for a market.
After we have our model, we'll look at how sensitive these curves are to changes in price by looking at elasticity. Finally, we'll fully understand supply and demand by understanding what it means for a market to be in equilibrium.
Once we have the basics, we can start the fun! We'll look at disequilibrium, government action, and international trade.
Let's break down each unit to understand what unit 2 is all about!
Unit 2.1: Demand
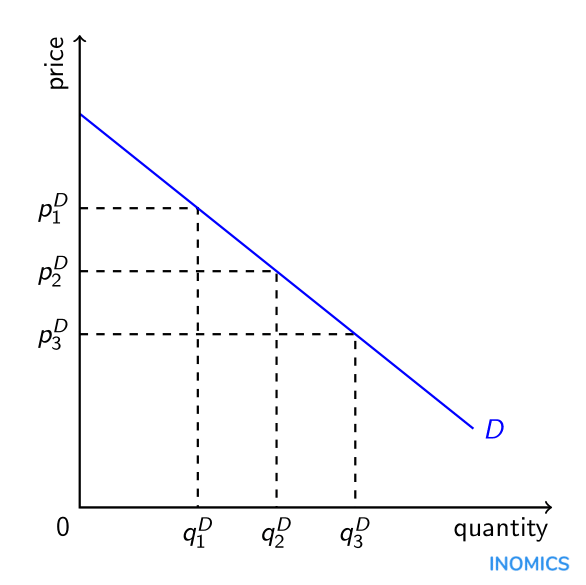
As a consumer, you buy different quantities of a good depending on the price. This is what demand is all about! The demand curve answers the fundamental question of "how much are consumers willing to buy at a given price point?"
We'll uncover the Law of Demand, which dictates that as prices rise, the quantity demanded declines. We'll use this fact to visualize the demand curve as a downward sloping curve.
We'll wrap up demand by understanding events that change quantity demanded for every price point, representing a shift in the demand curve!

Unit 2.2: Supply
Just as consumers relate quantity to price, so do producers! Unit 2.2 dives into how producers choose how much to produce depending on price. Like consumers, the fundamental question is "at the current price point, how much am I willing to supply?"
After this unit, we'll understand the Law of Supply, which tells us that as price increases, quantity supplied increases. We'll use this to construct the supply curve as an upward sloping curve.

Unit 2.3: Price Elasticity of Demand
We know that as price decreases, the quantity demanded increases, but by how much? This is the central question to understanding price elasticity of demand. Elasticity is a topic in economics that is all about how sensitive one thing is to another. In this case, we want to know how sensitive quantity demanded is to price changes. We have inelastic demand, where quantity demanded is not very sensitive to price changes, and we have elastic demand, which is the opposite.
We'll see how to mathematically calculate elasticity and what that looks like visually.

Unit 2.4: Price Elasticity of Supply
Price Elasticity of Supply is just what it sounds like - the same thing as PED but for supply! Instead of asking how sensitive quantity demanded is to price changes, we ask how sensitive quantity supplied is to price changes. Otherwise, everything we learned in 2.3 stays similar! We have inelastic and elastic supply.

Unit 2.5: Other Elasticities
Like we can ask how sensitive quantity demanded/supplied is to price, we can also ask how sensitive quantity demanded/supplied is to something else! This unit talks about two major types of other elasticities: Income Elasticity and Cross-Price Elasticity.
Income elasticity, as the name implies, describes the sensitivity of quantity demanded to changes in income. If quantity demanded increases when income increases (positive income elasticity), our good is normal. If quantity demanded decreases when income increases (negative income elasticity), our good is inferior.
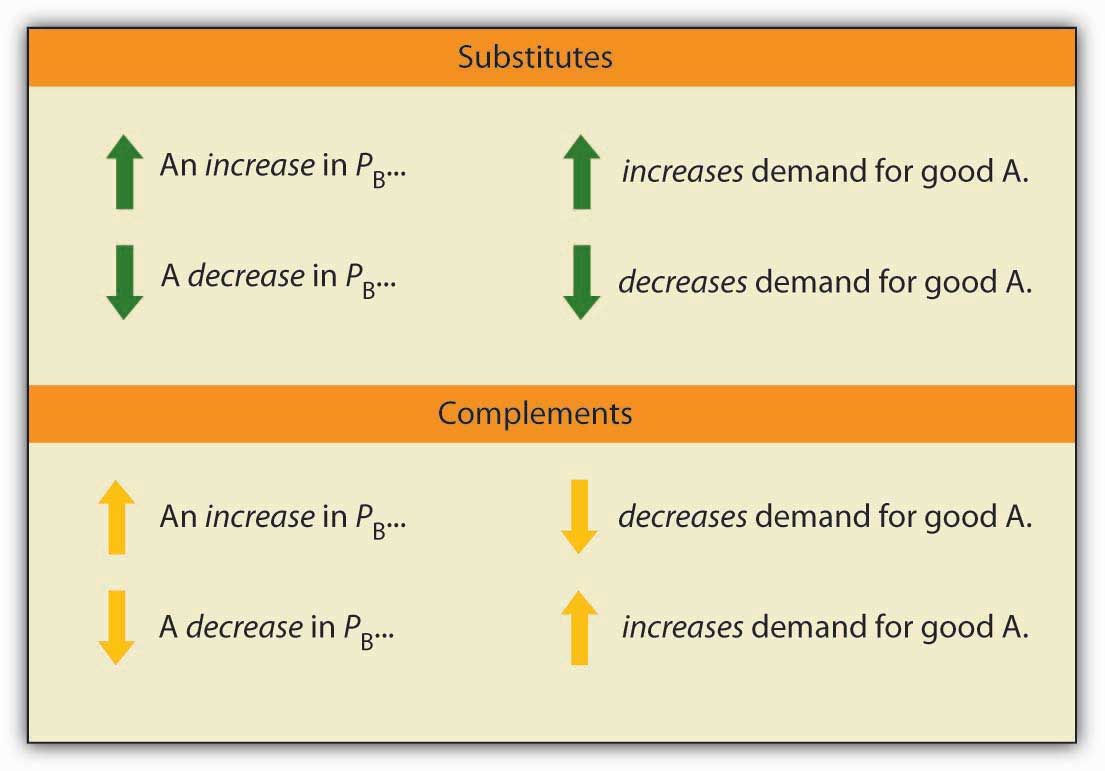
The second kind of elasticity is cross-price elasticity. This describes the sensitivity of quantity demanded to changes in price of a related good. This helps us understand if two goods are substitutes, complements, or completely unrelated. If the price of good B increases and the quantity demanded of good A increases (cross price elasticity is positive), we have substitutes. If it's negative, we have complements. If its perfectly 0, the goods are completely unrelated.


Unit 2.6: Market Equilibrium and Consumer and Producer Surplus
We've discussed demand and we've discussed supply, but how does the market function when we bring them together? We'll discover that a market equilibrates when the quantity demanded exactly equals the quantity supplied. This is because all people who are willing and able to get a good are able to actually get the good! If we were above or below this point, one of the parties involved would have to much or too little...but we'll leave that for 2.7.
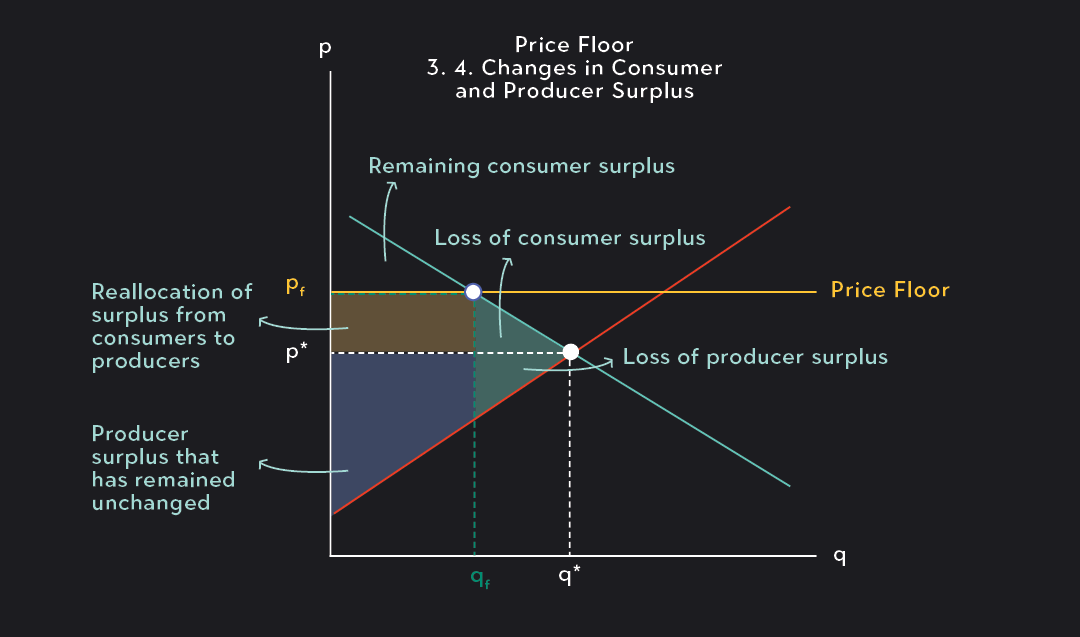
We'll also see that at equilibrium, there are some consumers that were willing to pay a higher price, but paid the equilibrium price. This means they actually gained more than they paid! This is called consumer surplus. The same goes for a producer who was willing to sell below equilibrium. They got extra money they were willing not to get. This is called producer surplus.

Unit 2.7: Market Disequilibrium and Changes in Equilibrium
Back to what happens when the market is gasp not in equilibrium. What happens if the market price is too high or low such that we have excess demand or excess supply? When this happens, we either have a surplus or a shortage. Because some consumers or producers can't fully satisfy themselves, we also lose some surplus! This leads to deadweight loss in the market - surplus that we've lost because we're not operating at the allocatively efficient outcome.

Unit 2.8: The Effects of Government Intervention in Markets
We have consumers and producers, but we also have the government as an entity that can get involved in markets!
We have two main actions of the government we're interested in: price controls and taxes.
Price controls are things like price ceilings and price floors and look just like disequilibrium graphs we saw before. We have effective price controls that are placed correctly relative to equilibrium, and ineffective price controls placed incorrectly relative to equilibrium.
We'll also discuss excise taxes, which are per unit taxes. We'll see how this impacts the supply curve and how the government collects tax revenues from such a tax.

Unit 2.9: International Trade and Public Policy
While most of our discussions in AP Micro concern a closed economy, we have to acknowledge that we are operating within the world! This means that the world price might be lower than equilibrium in the domestic market, but we can import goods to fulfill the shortage that would otherwise occur! We also will discuss tariffs and quotas that protect domestic markets from too much reliance on trade. These, like other policies, lead to deadweight loss.


<< Hide Menu
dylan_black_2025
dylan_black_2025
Unit 2 Overview: Supply and Demand
Unit 2 of AP Micro is the first micro specific unit in this class! Unlike unit 1, which is almost entirely the same between AP Macro and AP Micro, unit 2 will dive deep into some directly microeconomic topics. In particular, we'll be uncovering the most fundamental model in microeconomics: supply and demand. We'll begin by developing what the model looks like and actually means, and then look into some more detailed topics regarding how the model changes under certain conditions.
To begin, we have to understand what we mean by a market. In microeconomics, a market is a social structure that brings together consumers, or demanders, and producers, or suppliers. These two groups either purchase goods or sell goods, meaning they are mutually dependent on each other. For a consumer to consume, there must be a producer to produce, and vice-versa.
We'll then move into how consumers and producers act by constructing the demand curve for consumers and the supply curve for producers. These curves model how consumers and producers react to changes in price for a market.
After we have our model, we'll look at how sensitive these curves are to changes in price by looking at elasticity. Finally, we'll fully understand supply and demand by understanding what it means for a market to be in equilibrium.
Once we have the basics, we can start the fun! We'll look at disequilibrium, government action, and international trade.
Let's break down each unit to understand what unit 2 is all about!
Unit 2.1: Demand
As a consumer, you buy different quantities of a good depending on the price. This is what demand is all about! The demand curve answers the fundamental question of "how much are consumers willing to buy at a given price point?"
We'll uncover the Law of Demand, which dictates that as prices rise, the quantity demanded declines. We'll use this fact to visualize the demand curve as a downward sloping curve.
We'll wrap up demand by understanding events that change quantity demanded for every price point, representing a shift in the demand curve!

Unit 2.2: Supply
Just as consumers relate quantity to price, so do producers! Unit 2.2 dives into how producers choose how much to produce depending on price. Like consumers, the fundamental question is "at the current price point, how much am I willing to supply?"
After this unit, we'll understand the Law of Supply, which tells us that as price increases, quantity supplied increases. We'll use this to construct the supply curve as an upward sloping curve.

Unit 2.3: Price Elasticity of Demand
We know that as price decreases, the quantity demanded increases, but by how much? This is the central question to understanding price elasticity of demand. Elasticity is a topic in economics that is all about how sensitive one thing is to another. In this case, we want to know how sensitive quantity demanded is to price changes. We have inelastic demand, where quantity demanded is not very sensitive to price changes, and we have elastic demand, which is the opposite.
We'll see how to mathematically calculate elasticity and what that looks like visually.

Unit 2.4: Price Elasticity of Supply
Price Elasticity of Supply is just what it sounds like - the same thing as PED but for supply! Instead of asking how sensitive quantity demanded is to price changes, we ask how sensitive quantity supplied is to price changes. Otherwise, everything we learned in 2.3 stays similar! We have inelastic and elastic supply.

Unit 2.5: Other Elasticities
Like we can ask how sensitive quantity demanded/supplied is to price, we can also ask how sensitive quantity demanded/supplied is to something else! This unit talks about two major types of other elasticities: Income Elasticity and Cross-Price Elasticity.
Income elasticity, as the name implies, describes the sensitivity of quantity demanded to changes in income. If quantity demanded increases when income increases (positive income elasticity), our good is normal. If quantity demanded decreases when income increases (negative income elasticity), our good is inferior.
The second kind of elasticity is cross-price elasticity. This describes the sensitivity of quantity demanded to changes in price of a related good. This helps us understand if two goods are substitutes, complements, or completely unrelated. If the price of good B increases and the quantity demanded of good A increases (cross price elasticity is positive), we have substitutes. If it's negative, we have complements. If its perfectly 0, the goods are completely unrelated.


Unit 2.6: Market Equilibrium and Consumer and Producer Surplus
We've discussed demand and we've discussed supply, but how does the market function when we bring them together? We'll discover that a market equilibrates when the quantity demanded exactly equals the quantity supplied. This is because all people who are willing and able to get a good are able to actually get the good! If we were above or below this point, one of the parties involved would have to much or too little...but we'll leave that for 2.7.
We'll also see that at equilibrium, there are some consumers that were willing to pay a higher price, but paid the equilibrium price. This means they actually gained more than they paid! This is called consumer surplus. The same goes for a producer who was willing to sell below equilibrium. They got extra money they were willing not to get. This is called producer surplus.

Unit 2.7: Market Disequilibrium and Changes in Equilibrium
Back to what happens when the market is gasp not in equilibrium. What happens if the market price is too high or low such that we have excess demand or excess supply? When this happens, we either have a surplus or a shortage. Because some consumers or producers can't fully satisfy themselves, we also lose some surplus! This leads to deadweight loss in the market - surplus that we've lost because we're not operating at the allocatively efficient outcome.

Unit 2.8: The Effects of Government Intervention in Markets
We have consumers and producers, but we also have the government as an entity that can get involved in markets!
We have two main actions of the government we're interested in: price controls and taxes.
Price controls are things like price ceilings and price floors and look just like disequilibrium graphs we saw before. We have effective price controls that are placed correctly relative to equilibrium, and ineffective price controls placed incorrectly relative to equilibrium.
We'll also discuss excise taxes, which are per unit taxes. We'll see how this impacts the supply curve and how the government collects tax revenues from such a tax.

Unit 2.9: International Trade and Public Policy
While most of our discussions in AP Micro concern a closed economy, we have to acknowledge that we are operating within the world! This means that the world price might be lower than equilibrium in the domestic market, but we can import goods to fulfill the shortage that would otherwise occur! We also will discuss tariffs and quotas that protect domestic markets from too much reliance on trade. These, like other policies, lead to deadweight loss.


© 2024 Fiveable Inc. All rights reserved.