Browse By Unit
Dylan Black
Dalia Savy
Dylan Black
Dalia Savy
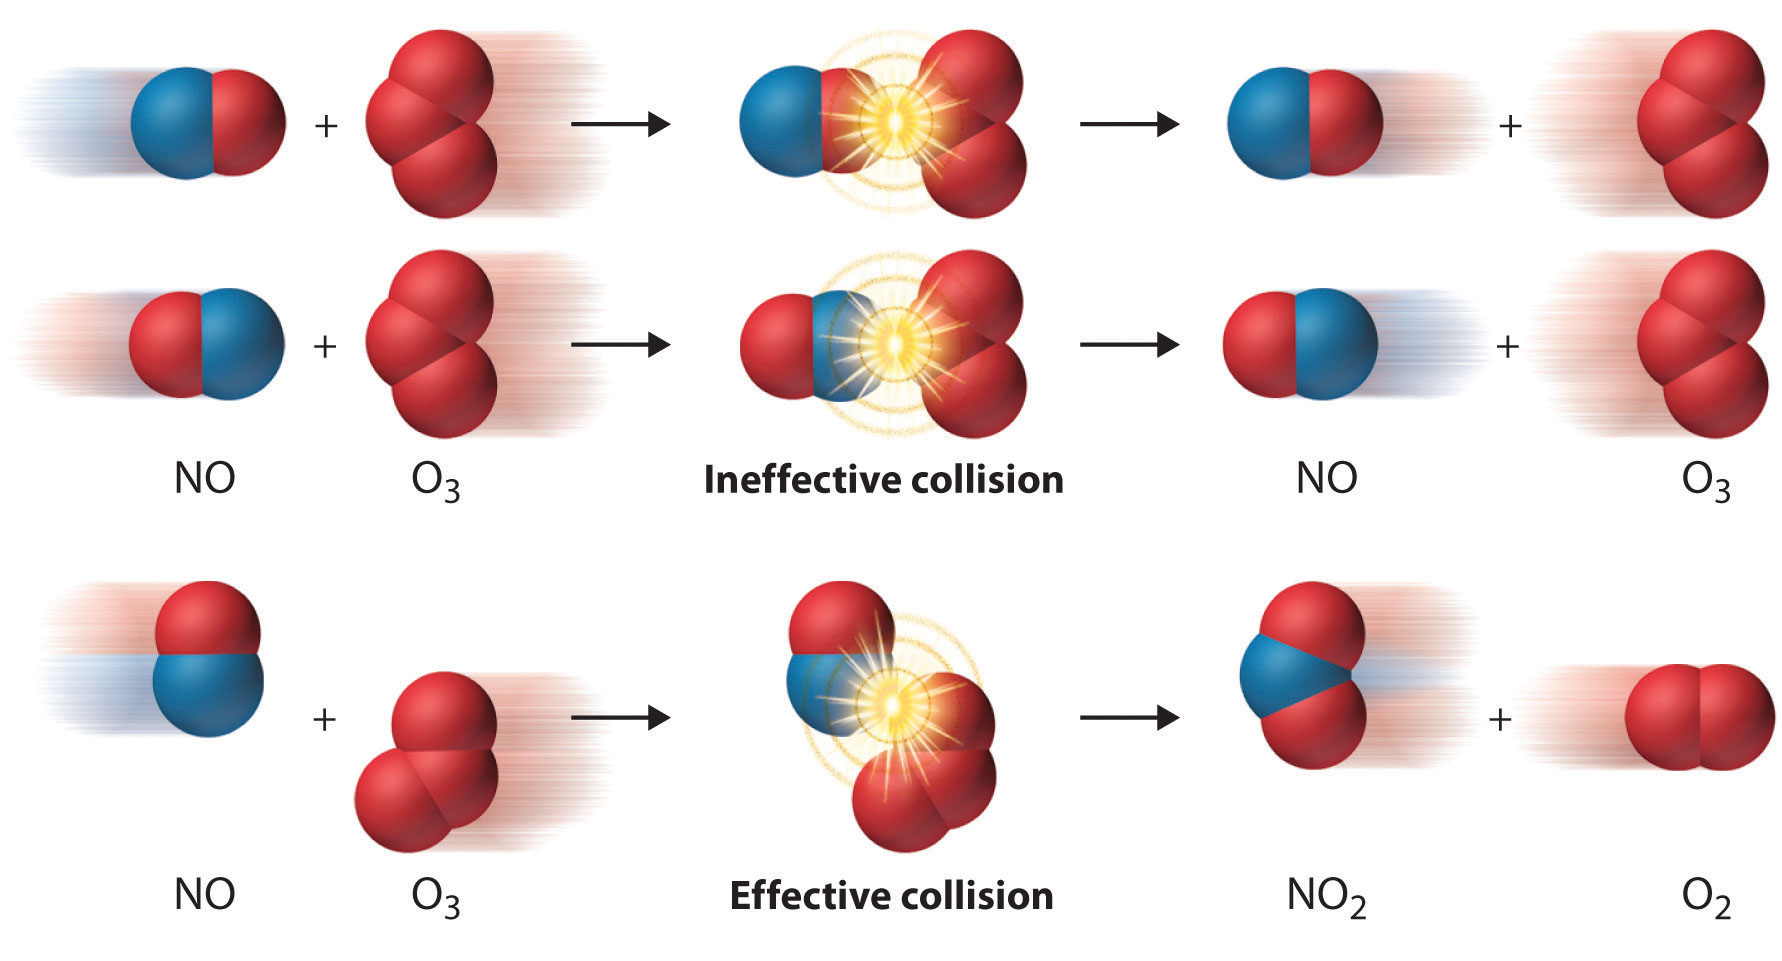
In the last study guide for this unit, we discussed the collision model that models molecules as projectiles moving in random directions with a fixed average speed that is determined by temperature. The main gist of it is that in order for a collision to be "effective" and result in a chemical reaction, two conditions must be satisfied:
- There must be enough energy to cause the reaction.
- The reactants must be arranged in the correct orientation to form the products.

In this study guide, we'll be focusing on the energy of reactions, so the first condition. Let's dive in!
Energy In Reactions
Elementary Reactions
One last thing! What is an elementary reaction you may ask? An elementary reaction is a chemical reaction that occurs in a single step and involves only a single molecule or a group of atoms. It is the most basic type of chemical reaction and is the starting point for understanding more complex reactions.
As we've seen, elementary reactions can be either first-order or second-order, depending on whether the rate of the reaction is dependent on the concentration of one species or two. Some specific examples of elementary reactions include the reaction of hydrogen and oxygen to form water, the decomposition of ozone, and the ionization of a gas.
The key thing to remember is that elementary reactions involve the breaking of some bonds and the formation of other bonds and these concepts tie directly into how much energy is associated with a chemical reaction.
Endothermic vs. Exothermic PE Graphs
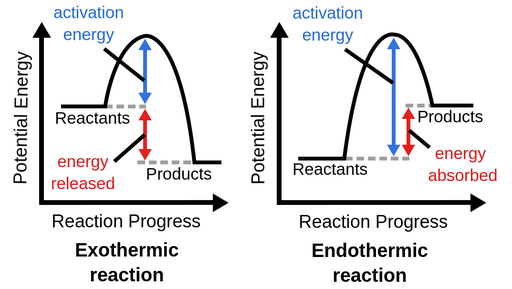
As you have probably seen, potential energy in a reaction can be represented as a curve with a hump as the reaction progresses, with energy changes being able to be seen regarding the reaction. This is called a reaction coordinate or a potential energy diagram.
Typically, these are used to tell us if a reaction is endothermic or exothermic, that is to say, is the system gaining energy or losing energy with respect to its initial and final energies? Here are what the differing graphs look like:

Image Courtesy of Labster Theory
You can ignore "activation energy" for now, we'll get into that in the next section. What's important for you to understand is that in a reaction, energy is either released or absorbed and this will affect the energy involved in getting the reaction started.
Here is what you should notice and recognize:
- In an endothermic reaction, the potential energy of the reactants is less than the potential energy of the products. This means that there must be energy put into the reaction in order to raise the particles up to a higher energy level. In other words, energy is put into the reaction or absorbed.- You can think of an endothermic reaction as Reactants + Energy → Products
- In an exothermic reaction, the potential energy of the reactants is greater than the potential energy of the products. This means that there has to be some sort of "loss" of energy throughout the reaction. In other words, some of the potential energy of the reactants is released into the surroundings. - Where does it go? Well, it typically is converted into kinetic energy, which is the heat released in exothermic reactions.- You can think of an exothermic reaction as Reactants → Products + Energy So far, when you take a look at a potential energy diagram, you should be able to tell if it is showing the energy of an endothermic reaction or an exothermic reaction.
The Progress of a Reaction
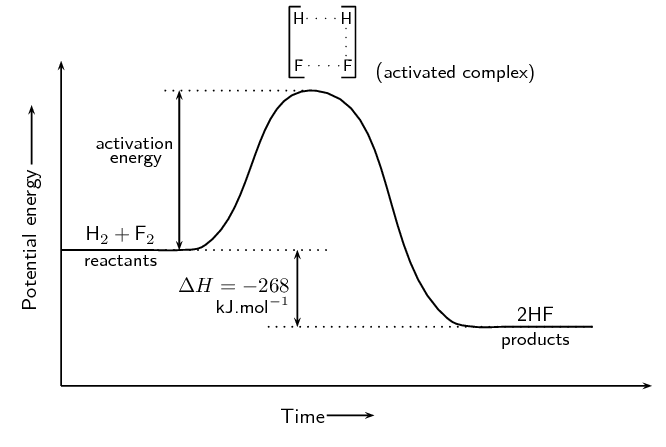
There are three main parts of a reaction that are shown in a reaction coordinate: the reactants, the activated complex, and the products.
- The reactants, as you know, are the chemicals that go into the reaction. It is always going to be at the very left of a PE graph, as the x-axis represents the progress of the reaction.
- The activated complex, also known as the transition state, is the highest point on the PE graph. Since it is the highest point, this complex has the highest energy and is therefore the most unstable point of the reaction.1. You can think of this as the middle point, where the reaction is transitioning from reactants to products. The bonds are not yet completely broken or formed.
- The products are what come out of the chemical reaction! They are always going to be the plateau at the very right of the PE graph.

Activation Energy
What is Activation Energy?
Activation energy is actually quite simple—it is the energy required to break the bonds in a reaction to go from the reactants to the activated complex to the products. It is defined formally as "the energy difference between the reactants and the transition state" according to the College Board. On an energy diagram, this is shown by an arrow from the reactants to the peak of the graph, as you can see in the prior images.
Conceptually, you can think of activation energy as the minimum amount of energy required to start a chemical reaction. It is kind of like an energy barrier that must be overcome for the reactants to form the activated complex and then proceed to the products.
The lower the activation energy, the more likely the reaction will occur, and the faster the reaction will proceed. On the other hand, reactions with high activation energy are less likely to occur and proceed more slowly. Activation energy is an important concept in understanding the kinetics of chemical reactions and can be used to predict the rate of a reaction and the feasibility of a reaction.
The Arrhenius Equation
The Arrhenius equation is an empirical relationship that describes how the rate constant of a chemical reaction changes with temperature. Remember how we kept emphasizing it? Well, Arrhenius' equation describes exactly how much the rate constant of an elementary reaction changes with changes in temperature by relating it to the activation energy needed to reach the transition state.

Note that for the AP exam, you will not have to use this equation to make calculations..
<< Hide Menu
Dylan Black
Dalia Savy
Dylan Black
Dalia Savy
In the last study guide for this unit, we discussed the collision model that models molecules as projectiles moving in random directions with a fixed average speed that is determined by temperature. The main gist of it is that in order for a collision to be "effective" and result in a chemical reaction, two conditions must be satisfied:
- There must be enough energy to cause the reaction.
- The reactants must be arranged in the correct orientation to form the products.

In this study guide, we'll be focusing on the energy of reactions, so the first condition. Let's dive in!
Energy In Reactions
Elementary Reactions
One last thing! What is an elementary reaction you may ask? An elementary reaction is a chemical reaction that occurs in a single step and involves only a single molecule or a group of atoms. It is the most basic type of chemical reaction and is the starting point for understanding more complex reactions.
As we've seen, elementary reactions can be either first-order or second-order, depending on whether the rate of the reaction is dependent on the concentration of one species or two. Some specific examples of elementary reactions include the reaction of hydrogen and oxygen to form water, the decomposition of ozone, and the ionization of a gas.
The key thing to remember is that elementary reactions involve the breaking of some bonds and the formation of other bonds and these concepts tie directly into how much energy is associated with a chemical reaction.
Endothermic vs. Exothermic PE Graphs
As you have probably seen, potential energy in a reaction can be represented as a curve with a hump as the reaction progresses, with energy changes being able to be seen regarding the reaction. This is called a reaction coordinate or a potential energy diagram.
Typically, these are used to tell us if a reaction is endothermic or exothermic, that is to say, is the system gaining energy or losing energy with respect to its initial and final energies? Here are what the differing graphs look like:

Image Courtesy of Labster Theory
You can ignore "activation energy" for now, we'll get into that in the next section. What's important for you to understand is that in a reaction, energy is either released or absorbed and this will affect the energy involved in getting the reaction started.
Here is what you should notice and recognize:
- In an endothermic reaction, the potential energy of the reactants is less than the potential energy of the products. This means that there must be energy put into the reaction in order to raise the particles up to a higher energy level. In other words, energy is put into the reaction or absorbed.- You can think of an endothermic reaction as Reactants + Energy → Products
- In an exothermic reaction, the potential energy of the reactants is greater than the potential energy of the products. This means that there has to be some sort of "loss" of energy throughout the reaction. In other words, some of the potential energy of the reactants is released into the surroundings. - Where does it go? Well, it typically is converted into kinetic energy, which is the heat released in exothermic reactions.- You can think of an exothermic reaction as Reactants → Products + Energy So far, when you take a look at a potential energy diagram, you should be able to tell if it is showing the energy of an endothermic reaction or an exothermic reaction.
The Progress of a Reaction
There are three main parts of a reaction that are shown in a reaction coordinate: the reactants, the activated complex, and the products.
- The reactants, as you know, are the chemicals that go into the reaction. It is always going to be at the very left of a PE graph, as the x-axis represents the progress of the reaction.
- The activated complex, also known as the transition state, is the highest point on the PE graph. Since it is the highest point, this complex has the highest energy and is therefore the most unstable point of the reaction.1. You can think of this as the middle point, where the reaction is transitioning from reactants to products. The bonds are not yet completely broken or formed.
- The products are what come out of the chemical reaction! They are always going to be the plateau at the very right of the PE graph.

Activation Energy
What is Activation Energy?
Activation energy is actually quite simple—it is the energy required to break the bonds in a reaction to go from the reactants to the activated complex to the products. It is defined formally as "the energy difference between the reactants and the transition state" according to the College Board. On an energy diagram, this is shown by an arrow from the reactants to the peak of the graph, as you can see in the prior images.
Conceptually, you can think of activation energy as the minimum amount of energy required to start a chemical reaction. It is kind of like an energy barrier that must be overcome for the reactants to form the activated complex and then proceed to the products.
The lower the activation energy, the more likely the reaction will occur, and the faster the reaction will proceed. On the other hand, reactions with high activation energy are less likely to occur and proceed more slowly. Activation energy is an important concept in understanding the kinetics of chemical reactions and can be used to predict the rate of a reaction and the feasibility of a reaction.
The Arrhenius Equation
The Arrhenius equation is an empirical relationship that describes how the rate constant of a chemical reaction changes with temperature. Remember how we kept emphasizing it? Well, Arrhenius' equation describes exactly how much the rate constant of an elementary reaction changes with changes in temperature by relating it to the activation energy needed to reach the transition state.

Note that for the AP exam, you will not have to use this equation to make calculations..

© 2025 Fiveable Inc. All rights reserved.